Enterprise Visual Intelligence by Arka
Don't start with the chart. Start with what the person needs to understand.
Enterprise Visual Intelligence is the discipline of turning business requirements into clear, decision-ready reporting.
Business requirements → reporting judgment → visual design → decision-ready information
The problem
A correct report can still be a bad report.
The data may be accurate. The calculations may be perfect. And the report may still make the reader work far too hard.
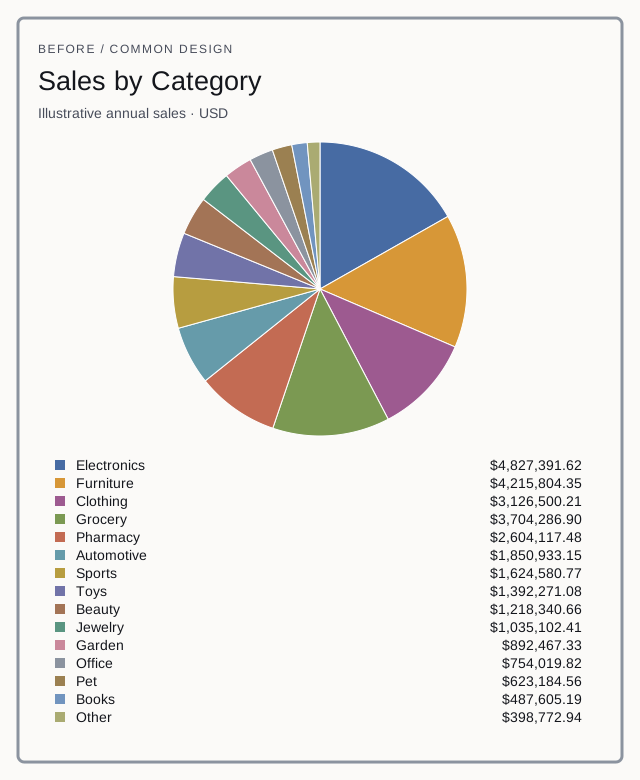
Fifteen categories squeezed into a pie chart. Legends that force the eye back and forth. KPI cards competing for attention. Tables that stretch across thirty columns.
EVI is Arka's approach to designing reports, dashboards and visual communication around the decision being made. It deals with what happens after the numbers are correct: how should those numbers actually be presented?
The approach
Reporting judgment before visualization.
Understand the question. Choose the right representation. Remove what doesn't help. Make the answer obvious.
EVI in action · Illustrative case study
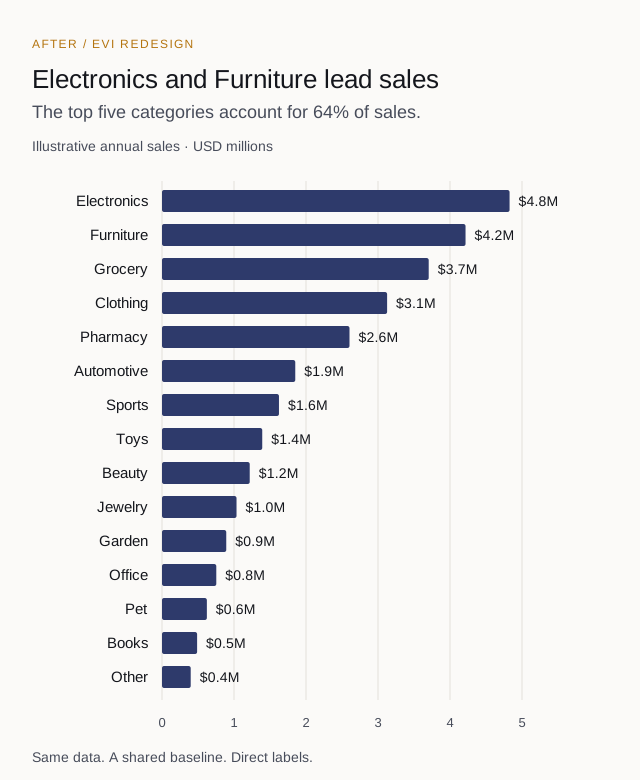
Fifteen sales categories. Should you use a pie chart?
If the question is “Which categories generate the most revenue?”, ranked bars make the comparison easier. These two views use exactly the same sample data.
What EVI covers
Clearer information, at every level.
For analysts, BI developers, reporting leads and the teams who depend on their work.
Visual selection
Choose the representation that fits the question.
Information hierarchy
Decide what should be noticed first, second and third.
Report layout
Organize dashboards, operational reports and executive views.
Tables & detailed reporting
Present exact information without turning it into visual noise.
Report critique & redesign
Explain why a report is difficult to use and how to improve it.
Enterprise consistency
Develop reporting conventions teams can use repeatedly.
Have a report that doesn't feel right?
Tell us who uses it, what they need to understand and what decision follows. Include an anonymized screenshot if useful.