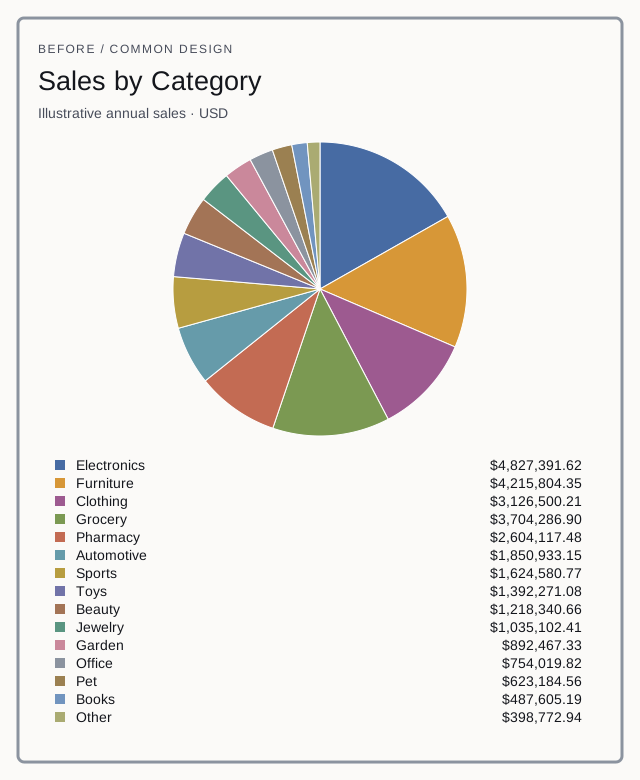
The EVI redesign: make the comparison direct
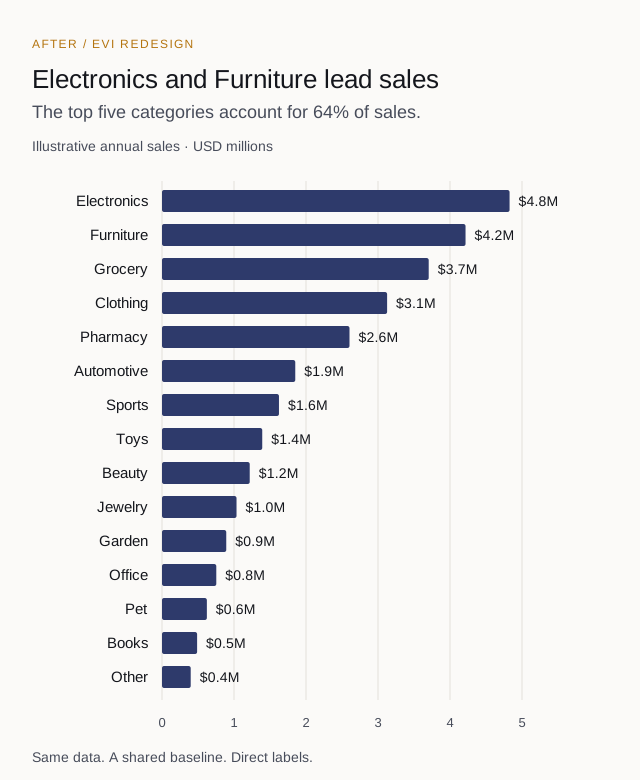
The ranked horizontal bars share a zero baseline. Category names sit beside the bars, and the values appear at their ends. Descending order reveals the ranking without asking the reader to reconstruct it.
Electronics and Furniture lead sales; the top five categories account for 64% of revenue. The title is a finding supported by this sample dataset. All fifteen categories remain visible, including the original “Other” category.
Why EVI changed it
Design decisions and their purpose| Decision | Reason |
|---|
| Pie → horizontal bars | Compare lengths from a common baseline. |
| Sort descending | Show the ranking without extra interpretation. |
| Label directly | Remove repeated trips to a legend. |
| Use one color | Keep attention on values; reserve emphasis for a reason. |
| Show $4.8M, not $4,827,391.62 | Match displayed precision to the comparison task; preserve exact values below. |
| Write a descriptive title | State the finding supported by the data. |
| Use whitespace | Separate information without decorative borders. |
Change the question, change the visual
How concentrated are sales? Show the largest few categories and a clearly labeled remainder if it helps answer the question. Check what the grouping hides. A small category may still be strategically important.
Which categories are growing or declining? Add comparable periods. A line chart or small multiples can show change over time; one annual total cannot tell you growth.
What are the exact daily sales across eight regions? A well-organized table may serve an operations manager better. For actual versus budget, show variance against the target.
What's the clearest way to answer this business question?
That is Enterprise Visual Intelligence: the discipline of turning business requirements into clear, decision-ready reporting. Same data. Different question. Different visual.
View the sample data and check the comparison
Fictional annual sales in USD, created for this demonstration. Values are unchanged between charts; bar labels are rounded to one decimal place in millions.
Sample annual sales by category| Category | Sales (USD) |
|---|
| Electronics | $4,827,391.62 |
| Furniture | $4,215,804.35 |
| Grocery | $3,704,286.90 |
| Clothing | $3,126,500.21 |
| Pharmacy | $2,604,117.48 |
| Automotive | $1,850,933.15 |
| Sports | $1,624,580.77 |
| Toys | $1,392,271.08 |
| Beauty | $1,218,340.66 |
| Jewelry | $1,035,102.41 |
| Garden | $892,467.33 |
| Office | $754,019.82 |
| Pet | $623,184.56 |
| Books | $487,605.19 |
| Other | $398,772.94 |
| Total | $28,755,378.47 |
The five largest categories total $18,478,100.56, or 64.26% of all sales (rounded to 64% in the headline).
Have a report that doesn't feel right? Tell us who uses it, what they need to understand and what decision follows.
Email a report for EVI review; include an anonymized screenshot if useful.